Chaos drills for a streaming system: what restarting and killing every component taught me
How to design a failure drill that measures what operators see, not uptime: 0 of 42,950 readings lost, and 4 bugs found and fixed in a Kafka pipeline.
I killed my pipeline's processor. It was running again a second later, but the screen didn't show current data until 9.5 s after the kill. The distance between "the container is up" and "the operator can trust the screen" is what this post measures.
For this round of Kafka chaos testing I restarted or killed each component of a live pipeline, one at a time, while a client watched the output like an operator's screen. Then I checked the history database for anything lost or repeated. The result: 0 of 42,950 readings lost, 0 duplicates, and four real bugs found, each fixed in code.
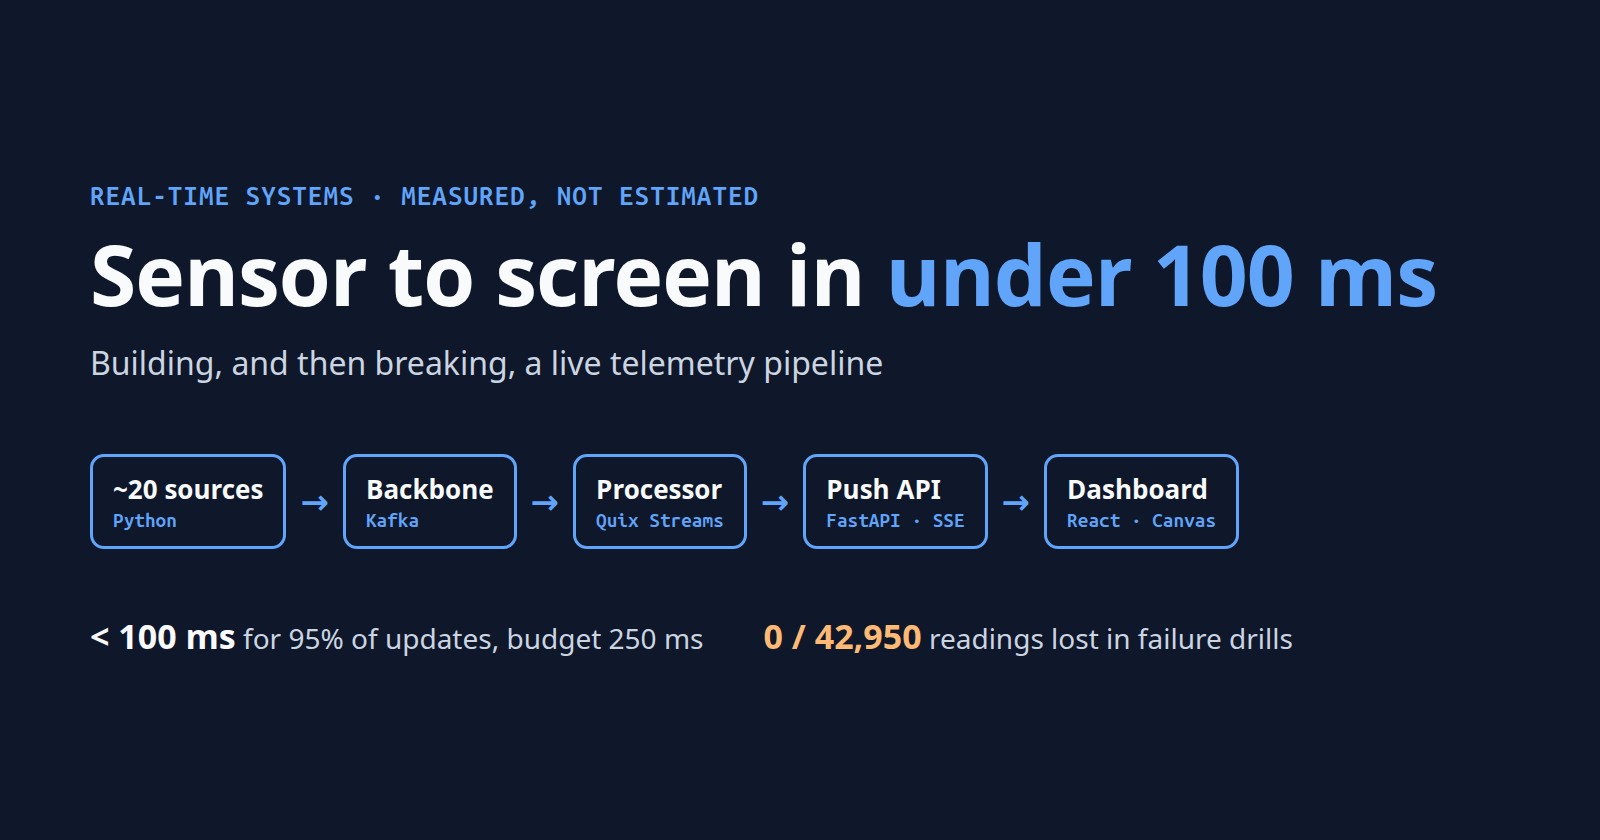
The system under test is the pipeline from part 1 (a simulator for about 20 sources, Kafka, a Quix Streams processor whose step 2 builds the fleet-wide view, a FastAPI push API over Server-Sent Events, a Valkey snapshot cache and a TimescaleDB history writer), run once last week at 2× speed on one host with one Kafka broker. This is part 3 of the "Building a Real-Time Pipeline" series: how to design the drill, prove nothing was lost, and trace each bug from symptom to fix.
Restart or kill: which faults does a drill need?
Both, because they exercise different code.
- Restart is
docker compose restart <service>: SIGTERM, then start. Shutdown code gets a chance to flush, commit and close. - Kill is
docker kill -s KILL, started again 1 s later. Nothing runs on the way down: the crash case.
Docker treats docker kill as a manual stop and skips the restart: unless-stopped policy, so the drill script restarts killed containers itself:
def inject(kind: str, svc: str) -> None:
    if kind == "restart":
        sh("docker", "compose", "restart", svc)   # graceful: SIGTERM, then start
        return
    # docker kill is a crash for the process, but Docker counts it as a manual
    # stop, so the restart policy won't apply: start it again a second later
    sh("docker", "kill", "-s", "KILL", f"pipeline-{svc}-1")
    time.sleep(1.0)
    sh("docker", "compose", "start", svc)
Which metrics show what an operator actually sees?
Process uptime is the wrong metric: a container can be up for seconds before its output is on time again. So the drill's observer is a real client on the same SSE stream a browser uses, reconnecting the way EventSource does. For every fleet-view update it records arrival time and age (arrival minus the reading's creation timestamp). Three metrics follow:
- Longest silence: the largest interval between consecutive updates around the fault (normally about 0.05 s at 2×).
- On time again after: fault to the first 3 s window of on-time updates (at least 10, p95 age under 250 ms); a late backlog doesn't count.
- Worst staleness: the age of the oldest update shown while catching up.\
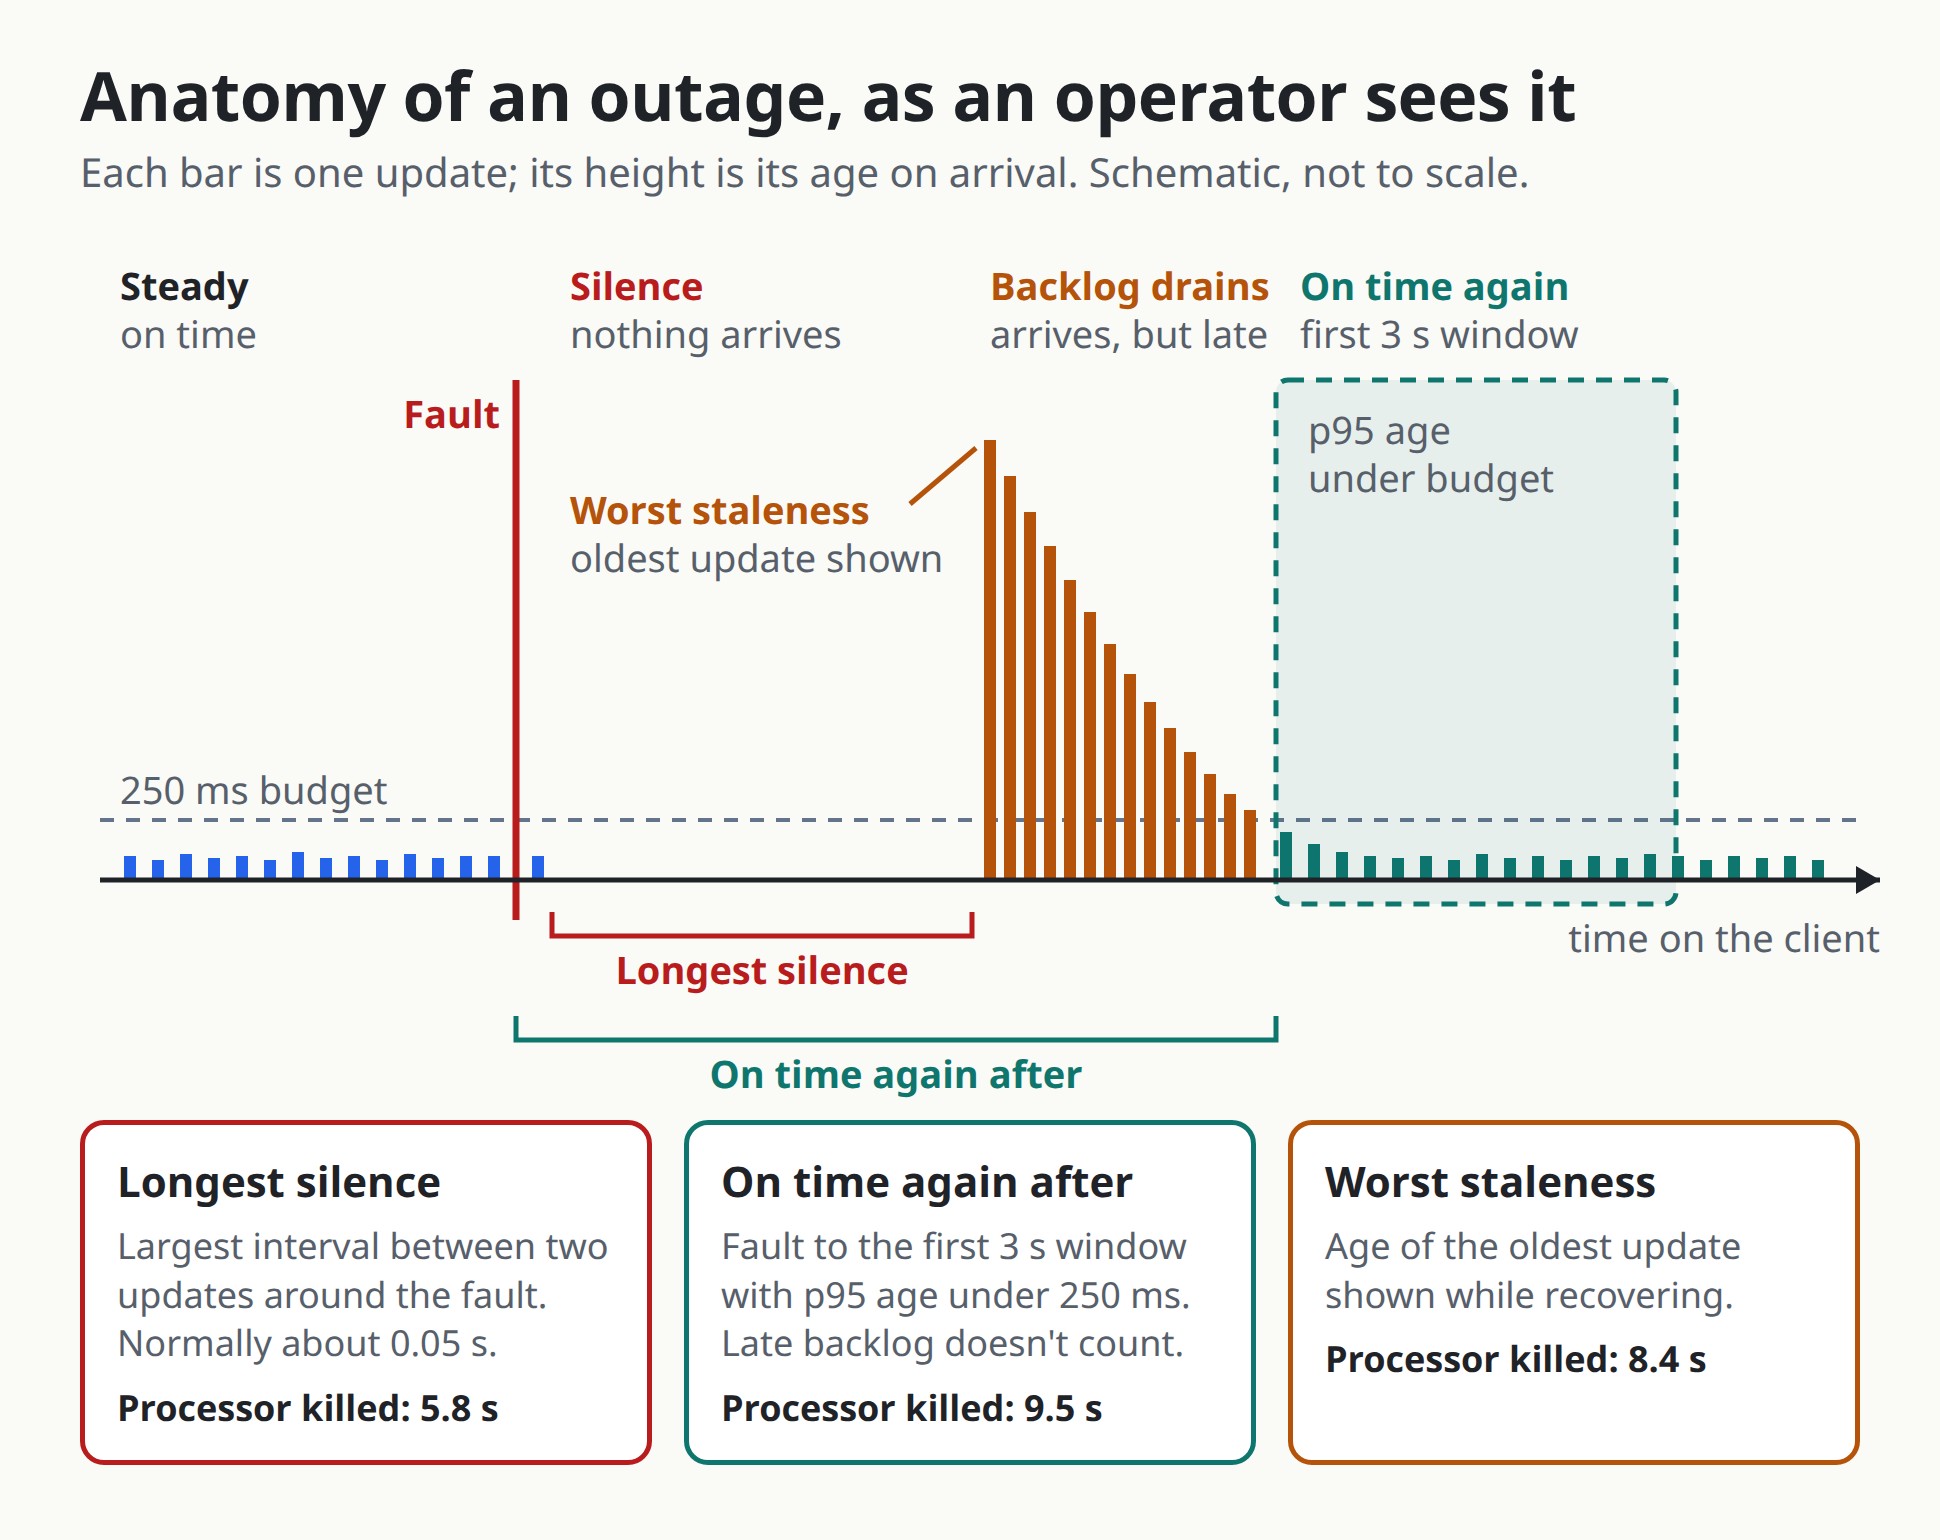
The recovery search is a sliding window over what the client received:
# from the end of the longest silence, slide a 3 s window in 0.1 s steps
t = silence_end
while t < time.time() - 3:
    ages = stream.window(t, t + 3)          # ages (ms) of updates received in [t, t+3)
    if len(ages) >= 10 and pct(sorted(ages), 95) < BUDGET_MS:
        recovered = max(t - t_fault, 0.0)   # fault -> start of the first on-time window
        break
    t += 0.1
Before each fault, the drill checks two things:
- Steady state. It waits (up to 90 s) until the last 3 seconds are on time, so one outage's backlog doesn't leak into the next.
- Source alive. It aborts if the simulated clock isn't advancing, because a frozen source looks exactly like an outage.
The drill results
| Fault | Longest silence | On time again after | SSE reconnects | Worst staleness |
|---|---|---|---|---|
| Restart processor | 3.2 s | 3.8 s | 0 | 3.2 s |
| Kill processor | 5.8 s | 9.5 s | 0 | 8.4 s |
| Restart API ¹ | 2.3 s | 4.6 s | 1 | 108 ms |
| Restart history writer | 0.1 s | no visible impact | 0 | 97 ms |
| Restart cache | 0.7 s | 1.4 s | 0 | 711 ms |
| Restart database | 0.1 s | no visible impact ² | 0 | 80 ms |
| Restart Kafka | 6.9 s | 11.5 s | 0 | 9.3 s |
| Kill Kafka | 22.9 s | 26.7 s | 1 | 23.6 s |
| Kill simulator ³ | session ends | idle once restarted | – | – |
¹ Re-measured after the API fix described below. ² Updates stayed on time throughout; there was no outage to recover from. ³ The simulator holds the session in memory; checkpointing it is later work.
- Stores off the live path are invisible to the operator. Restarting the database or the history writer had no visible impact.
- The API restart forces a reconnect but stays fresh. The restarted API starts reading at the newest offsets instead of replaying, so updates published while it was down never reach the screen, and nothing arrives late. A browser would also get the cached snapshot on reconnect; the drill's client ignores that event.
- Silence understates a stall. A stalled component comes back to a backlog that reaches the screen late, and only the staleness column shows it.
How do you prove nothing was lost or duplicated?
Ask the history database. Every reading carries a per-source sequence number, so each source should have max(seq) - min(seq) + 1 readings, and the distinct sequence numbers are what it has:
-- simplified; lost readings: sequence holes per source
select coalesce(sum(n_expected - n), 0), coalesce(sum(n), 0) from (
  select max(seq) - min(seq) + 1 as n_expected, count(distinct seq) as n
  from readings where session_id = $1 group by source_id) x;

-- duplicates: the same (source, seq) stored twice
select count(*) from (
  select source_id, seq from readings where session_id = $1
  group by 1, 2 having count(*) > 1) x;
For the whole session: 42,950 raw readings, 0 lost, 0 duplicates, and 0 duplicates in the stored fleet-view history. Part 1 covers why zero holds (idempotent producers, at-least-once consumers, commits after the database flush, ON CONFLICT DO NOTHING).
That check has two blind spots:
- It can't see loss at either end of a source's range: if a source's last readings never arrive,
max(seq)is simply lower. The drill's final fault, the simulator kill, would leave readings in its producer buffer, and the check would never see them. - It doesn't cover derived history. After the 23 s Kafka kill, the longest hole in the stored fleet-view history was 7.2 s of simulated time, against about 1 s normally (bug 3 explains why). The raw readings are complete, so it could be rebuilt offline.
The four bugs: symptom, cause, fix, result
1. Why did a killed processor wait about 45 s for its partitions?
Symptom: after a processor kill, the live view stayed silent for 52 s.
Cause: in Kafka's classic consumer-group protocol, a member that dies without leaving stays in the group until session.timeout.ms expires: 45 s by default in librdkafka and in the Java client since Kafka 3.0 (KIP-735). Only then did the restarted process get its partitions.
Fix: static membership. With a stable group.instance.id, the broker recognises the restarted process as the same member and hands back its cached assignment without a rebalance (KIP-345). It went on the processor and the history writer:
consumer_extra_config={
    "fetch.wait.max.ms": 10,
    # static membership: a restarted or crashed processor gets its partitions
    # back as soon as it rejoins, instead of waiting out the old session
    "group.instance.id": f"{settings.consumer_group}-0",
}
Result: the silence after a processor kill went from 52 s to 5.8 s.
Static membership has two costs. Two live processes can't share an ID: in the classic protocol, the broker gives the membership to whichever joined last and fences the other. So several processors need a unique, stable ID each (a pod ordinal, for example). And static members don't leave on shutdown, so an instance gone for good keeps its partitions until the session times out: that timeout now sets how long you tolerate a lost instance, not a restarted one.
All of this is the classic consumer-group protocol, which is still the client default and what this pipeline runs. Kafka 4's new protocol (KIP-848) is production-ready but opt-in (group.protocol=consumer), and librdkafka documents the fencing the other way round: a newcomer whose ID is still registered is rejected (UNRELEASED_INSTANCE_ID), so the old instance must shut down cleanly for its replacement to get in. The crash-recovery speed-up above is a classic-protocol result; I haven't measured it on the new protocol.
2. How did restarting a cache stop the whole system?
Symptom: restarting Valkey stopped the session.
Cause: Valkey runs without persistence, because it only holds the snapshot for newly connected screens. But the simulator also kept its single-instance lock there: the owner's ID with a 10 s time-to-live, refreshed with every heartbeat. The restart wiped it, the next refresh read the missing lock as "another instance took over", and the simulator stopped itself.
Fix: the refresh distinguishes missing from owned by someone else, atomically, in one Lua script (DaemonLock.refresh):
local v = redis.call('GET', KEYS[1])
if v == ARGV[1] then redis.call('PEXPIRE', KEYS[1], ARGV[2]) return 1 end  -- HELD
if not v then redis.call('SET', KEYS[1], ARGV[1], 'PX', ARGV[2]) return 2 end  -- REACQUIRED
return 0  -- LOST: a different owner holds it, stop
If a second instance grabs the empty key first, the first one sees a different owner and stops at its next refresh. The session ends, but there's never more than one owner.
Result: a cache restart now costs 0.7 s of silence, and the live view is on time again after 1.4 s.
Lesson: for every store, list what lives in it and what happens if it comes back empty.
3. Why were about 2 s of fleet-view updates skipped after a processor restart?
Symptom: after a processor restart, about 2 s of fleet-view updates were never emitted. Nothing errored.
Cause: step 2 emits an update for a tick once every required source has reported it, but a source more than 20 ticks behind the newest stops blocking, so one silent source can't freeze the fleet view. During catch-up, step 1 replayed one source's partition before another's, so source A ran 20 ticks further along than source B for a few milliseconds. The rule declared B silent, the update jumped forward, and B's catch-up readings arrived too late to count.
Fix: being behind in event time is no longer enough. A source counts as silent only after it has stayed behind for 2 s of wall-clock time (stage2.frame_tick):
def silent(src) -> bool:
    if src.tick >= newest_tick - stale_ticks:     # keeping up: clear its timer
        behind.pop(src.id, None)
        return False
    # behind: silent only once it has stayed behind for 2 s of wall clock
    return now_ns - behind.setdefault(src.id, now_ns) >= stale_wall_ns
The 2 s grace has a limit: after the 23 s Kafka kill, catch-up ran one source's backlog past another's for more than 2 s, so step 2 skipped updates rather than hold the live view back. That is the 7.2 s hole in the fleet-view history.
Lesson: replay is a different regime from live traffic. Any rule that judges silence by event time will misfire when a backlog replays in milliseconds.
4. Why did an API restart take 11 s?
Symptom: the API took 11 s to restart.
Cause: on SIGTERM, uvicorn waited for the open SSE streams to end. They never end on their own, so the stop ran into Docker's 10 s stop timeout and SIGKILL.
Fix: cap the wait at 2 s, since browsers reconnect anyway. Now the API takes 3.4 s to restart.
api:
  command: ["uvicorn", "api.main:app", "--host", "0.0.0.0", "--port", "8000",
            "--timeout-graceful-shutdown", "2"]
The one it found but couldn't explain
In one earlier run, the simulator's main loop stopped for 8 minutes while its heartbeat stayed alive, and three later runs didn't reproduce it. Rather than guess, I added a watchdog (Heartbeat.watchdog) that logs every thread's stack trace if the loop stalls for 5 s, so the next freeze comes with evidence.
What can't a single-host drill show?
- Network faults. No network splits, packet loss or slow links; every service shares one host.
- Partial failures. A killed container is a clean failure; a slow disk, a GC stall or a vanished host are untested.
- Repeatability. Each fault was injected once, so every figure is a single sample, not a distribution.
How to build your own failure drill
- Observe as a real client and define "recovered" by your latency budget, not process health, so a late backlog doesn't count.
- Restart and kill every component, one at a time, from steady state, starting killed containers yourself.
- Check history with sequence numbers (holes for loss, repeated keys for duplicates), and treat every surprise as a bug: fix it, then re-run that scenario.
None of the four bugs showed up in normal operation. Each lived in a restart, replay or shutdown path that only a drill exercises.
Part 1 of this series covers the pipeline's architecture and headline results;
Part 2 shows how its latency is measured. Next: why TimescaleDB doesn't fit on Amazon RDS, and what to run instead. If you run drills on your own streaming system, which metric do you use for "recovered"?
About the author
- I'm a full-stack engineer working mostly on backends and real-time systems: Python and FastAPI, Kafka and MQTT, Postgres and TimescaleDB, with React on the front end and CI and infrastructure around it. I write about what I build and break: the design trade-offs, the numbers I measured, and what I'd do differently. Now I'm moving into cloud and AI, and writing up what I learn along the way.
Comments
Join the discussionFor "recovered" I'd keep your on-time-window rule and change what you report: a spread over repeated kills, because where the kill lands in the commit cycle decides how much the processor replays. Quix Streams commits offsets and state every 5 seconds by default, and a killed processor resumes from the last commit. A kill just after a commit replays almost nothing; one just before it replays close to five seconds of input, which has to drain before the screen is on time again.
So I'd run each kill about 20 times, with a random delay so the signal lands at different points in that cycle, and report the median and the worst run side by side. Your single-sample caveat already names the gap, and I'd expect this to be the variable behind most of it.
Building a Real-Time Pipeline
How I built a real-time pipeline that gets 95% of updates on screen in under 100 ms, then broke it on purpose to see what survives. Each post covers one engineering decision: the options, what I chose, what it cost, and the numbers I measured. It starts with Kafka and failure drills and moves on to AWS and AI features.